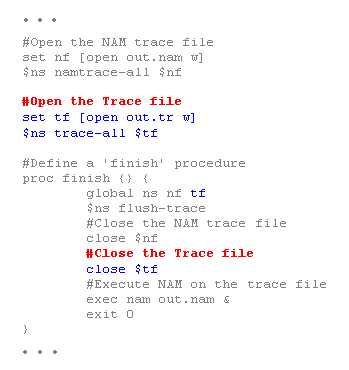
This section shows a trace analysis example. Example 4 is the same OTcl script as the one in the "Simple Simulation Example" section with a few lines added to open a trace file and write traces to it. For the network topology it generates and the simulation scenario, refer to Figure 4 in the "Simple Simulation Example" section. To run this script download "ns-simple-trace.tcl" and type "ns ns-simple-trace.tcl" at your shell prompt.

Example 4. Trace Enabled Simple NS Simulation Script (modified from Example 3)
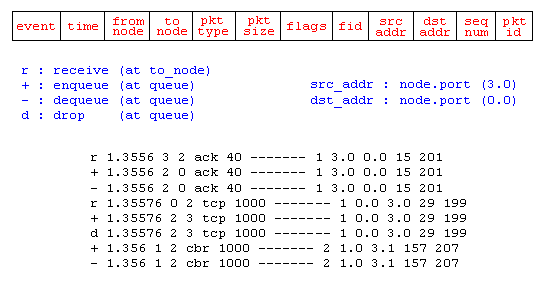
Running the above script generates a NAM trace file that is going to be used as an input to NAM and a trace file called "out.tr" that will be used for our simulation analysis. Figure 13 shows the trace format and example trace data from "out.tr".

Figure 13. Trace Format Example
Each trace line starts with an event (+, -, d, r) descriptor followed by the simulation time (in seconds) of that event, and from and to node, which identify the link on which the event occurred. Look at Figure 9 in the "Network Components" section to see where in a link each type of event is traced. The next information in the line before flags (appeared as "------" since no flag is set) is packet type and size (in Bytes). Currently, NS implements only the Explicit Congestion Notification (ECN) bit, and the remaining bits are not used. The next field is flow id (fid) of IPv6 that a user can set for each flow at the input OTcl script. Even though fid field may not used in a simulation, users can use this field for analysis purposes. The fid field is also used when specifying stream color for the NAM display. The next two fields are source and destination address in forms of "node.port". The next field shows the network layer protocol's packet sequence number. Note that even though UDP implementations do not use sequence number, NS keeps track of UDP packet sequence number for analysis purposes. The last field shows the unique id of the packet.
Having simulation trace data at hand, all one has to do is to transform a subset of the data of interest into a comprehensible information and analyze it. Down below is a small data transformation example. This example uses a command written in perl called "column" that selects columns of given input. To make the example work on your machine, you should download "column" and make it executable (i.e. "chmod 755 column"). Following is a tunneled shell command combined with awk, which calculates CBR traffic jitter at receiver node (n3) using data in "out.tr", and stores the resulting data in "jitter.txt".
| cat out.tr | grep " 2 3 cbr " | grep ^r | column 1 10 | awk '{dif = $2 - old2; if(dif==0) dif = 1; if(dif > 0) {printf("%d\t%f\n", $2, ($1 - old1) / dif); old1 = $1; old2 = $2}}' > jitter.txt |
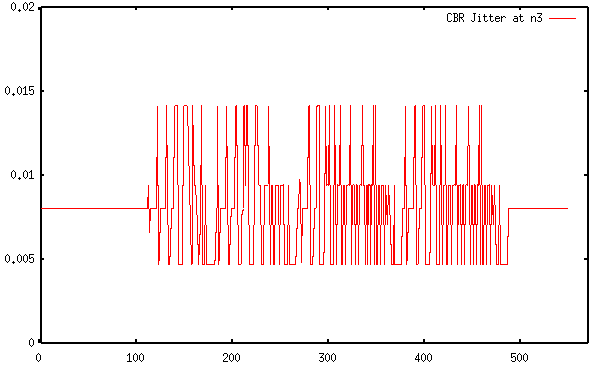
This shell command selects the "CBR packet receive" event at n3, selects time (column 1) and sequence number (column 10), and calculates the difference from last packet receive time divided by difference in sequence number (for loss packets) for each sequence number. The following is the corresponding jitter graph that is generated using gnuplot. The X axis show the packet sequence number and the Y axis shows simulation time in seconds.

Figure 14. CBR Jitter at The Receiving Node (n3)
You might also check for more utilities in the Example Utilities section.
This section showed an example of how to generate traces in NS, how to interpret them, and how to get useful information out from the traces. In this example, the post simulation processes are done in a shell prompt after the simulation. However, these processes can be included in the input OTcl script, which is shown in the next section.